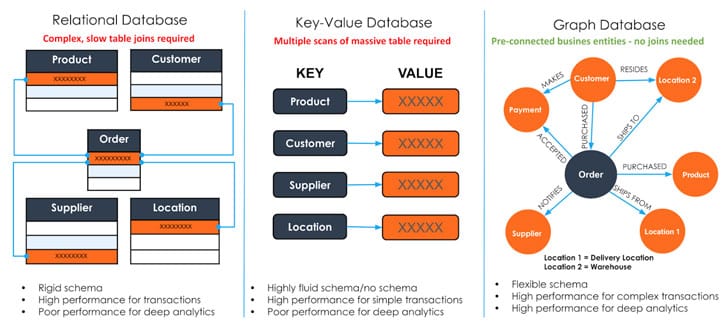
Graph Database and Analytics is a technology designed to manage these relationships. A graph database is the only data model where the business entities and their relationships are pre-connected. Graph Analytics offers a simplified way to analyze relationships among entities such as people, products, accounts, and locations. It does this using SQL-like queries that do not require programming experts.
Gartner estimates that the Graph Database and Analytics market will grow 100% annually from 2019 to 2022. It makes it one of the fastest-growing markets in the data and analytics landscape.
You Use Graphs Every Day
Every day when you search using Google, you are using Google’s Knowledge Graph. Google search returns the web pages that contain the information you are looking for. It uses a Graph algorithm called PageRank.
When you log in, search and view business contacts on LinkedIn, it shows the degrees of separation from a business contact, such as 1st, 2nd, 3rd-degree connection. It uses a graph database search on LinkedIn’s Professional Network Graph. This indicates the number of hops from you to the contact being reviewed. Every time you see common connections or common groups with a second-degree contact, or LinkedIn recommends you to connect with a professional contact, you are querying the professional network graph at LinkedIn.
Every time you use Amazon, Walmart or wish.com to shop, you see product recommendations. For example, “people who bought this item also bought” or “these items are often bought together”. That comes from a graph analytics query.
Every time you use Amazon, Twitter, Facebook or Instagram, you use graph database and analytics. Why aren’t these industry leaders using relational or NoSQL databases for storing and analyzing the data regarding relationships?
Challenges Using Relational or NoSQL Databases for Storing and Analyzing Relationships
- Relational databases store each business entity’s data such as customer, order, product and payment data in separate database tables. To understand and analyze relationships across the business entities, relational databases require table joins. These can take hours and are computationally expensive as the size of the data grows.
- NoSQL databases store all of the data in a single table. It means that the relationship analysis requires scanning a huge table with millions or billions of rows. It makes it very difficult to perform a deeper analysis of the relationships beyond two or three levels.
- Graph databases are purpose-built for storing and analyzing relationships among the data. The data entities and the relationships among them are pre-connected. They do not require time-consuming table joins or multiple scans across a large table.
With the inherent advantages of graph databases for managing the relationship data, it begs the next question – “why have enterprises not adopted graphs faster”?
Enterprise Adoption for Graph Databases
First-generation graph databases were built with native graph storage, however, could not handle large data sizes or query volumes. They were also not designed to perform beyond three levels or connections inside the graph. They are excellent for visualizing relationships among business entities but fail to go beyond proof of concept or academic research projects to scale up to the real-world requirements.
Second-generation graph databases were built on top of NoSQL storage. It allows them to load large amounts of data. However, they still do not scale for queries involving three or more connections or hops and can’t support complex graph analytics for analyzing the relationships. They also typically do not support database partitioning. It means a large graph with terabytes of data can’t be distributed into multiple servers, each with few hundreds of gigabytes of data.
First and second-generation graph databases do not meet enterprise requirements:
- Can’t scale to multiple machines for storing big data (database partitioning) and parallel query processing.
- Can’t support deep link analytics (go beyond three hops). This is essential for next-generation fraud detection, recommendation engines, machine learning & AI and other use cases.
- Unable to meet real-time requirements for updates and sub-second query performance on big data.
TigerGraph is a platform for advanced analytics and machine learning on connected data. Based on the industry’s first and only distributed native graph database It is a graph database purpose-built for loading massive amounts of data (terabytes) in hours. It can analyze as many as 10 or more hops deep into relationships in real-time. TigerGraph supports transactional and analytical workloads, is ACID compliant, scales up and out with database partitioning.
Learn more about it in the Native Parallel Graphs eBook and start with the free tier on TigerGraph Cloud today.
Join us at Graph + AI Summit 2021 the first and only open industry conference devoted to democratizing and accelerating analytics, AI and machine learning with graph algorithms. Register free today.
TigerGraph is a platform for advanced analytics and machine learning on connected data. Based on the industry’s first and only distributed native graph database, TigerGraph’s proven technology supports advanced analytics and machine learning applications such as fraud detection, anti-money laundering (AML), entity resolution, customer 360, recommendations, knowledge graph, cybersecurity, supply chain, IoT, and network analysis. The company is headquartered in Redwood City, California, USA. Start free with tigergraph.com/cloud.


