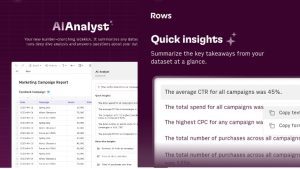

Rows Co-Founder and CEO Humberto Ayres Pereira said, “Analysing data is a huge part of working with spreadsheets, but this takes too much time and effort and is rarely engaging for people. Instead of spending time writing formulas, filtering and sorting data, building pivot tables or even finding someone to help them analyse the data, anyone can now spend more time thinking about their approach to a problem with their end goal in mind.
“The problem is that many people aren’t necessarily fully equipped with data analysis skills and miss out on crucial information and trends as a result. Of the over one billion spreadsheet users worldwide, a large proportion struggle with many intermediate to advanced functions familiar with data analysts. I see automating these processes and generating these insights automatically as the natural next step in the future of spreadsheets.”
AI Analyst
However, the new Rows AI Analyst takes the integration with AI a few steps further. The tool does not wait for a user to query. Instead, it surfaces analysis of the data input automatically. It offers three different features.
Quick Insights: This feature is similar to, but far more than, the Excel summary bar, automatically providing average, total and other calculations on highlighted cells. The feature analyses the data sheet and presents a summary of information based on the row and column headings and the data held on the Sheet. For example, it may highlight an average, the highest value, or a sum of a column or row. It will analyse the data and provide 3-5 simple answers to questions a user might ask based on that analysis.
Deep Dives: Rather than simple answers, this feature automatically generates pivots. It identifies trends and patterns in data and automatically generates charts or additional tables highlighting the trend or pattern for the user. Users can also see the source data and the formulae used to generate the new table. If the source data is updated, so is the new table.
Ask Anything: If users want to go beyond the initial insights, they can ask questions about the data. AI analyst will generate the answer or can even generate the requested pivot table or chart. Users can enter a question using a natural language interface. An example is, “What were the three best campaigns by total clicks.”
Rows AI Analyst is currently in beta but available to everybody across all plans. Over time Rows will continue to enhance the solution. No date was given for a general release. Data analysed never moves outside of Rows, and data analysed stays within the control of the organisation using it.
Enterprise Times: What does this mean
Rows AI Analyst is another example of how organisations build AI and Generative AI into their platforms. For analysts pouring over data, the new features should enable them to conduct the initial analysis quickly. What isn’t known is how complex questions can be answered. Are the insights limited to the data held within the spreadsheet? Can users leverage data held elsewhere?


