 Training is, I believe, a very important part of any one’s job. No matter how long you may have been at the job you need to continually improve your talents and abilities.
I have been training people for a long time now and hear this all the time: “I’ve been using the application for years and years. But I didn’t know it could do this!” There are continual improvements to software so why is it that managers feel it unnecessary to keep their staff updated with these improvements?
Do they think is it perfectly fine for staff to go and investigate a new feature and loose themselves for a couple of hours? If so GREAT. But most people do not have time to try new things out. Or don’t feel able to as they don’t understand what the feature could possibly do for them. That’s why training is so important as the trainer can introduce staff to new features and explain where these would come in useful.
I love Pivot Tables. It’s a feature that helps staff report to their managers just what’s going on in the company. There are many aspects to this subject. In my second tip on Pivot Tables I explained filters. There is another way to view and manipulate the data. This feature is called “Slicers”.
How to set up slicers
Here is a data table which we will create a Pivot Table from.
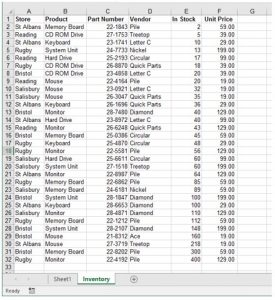 Follow the instruction in my previous tip on how to create a Pivot Table.
Here is the result.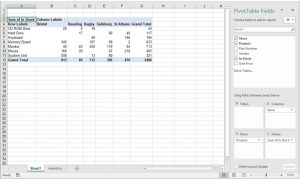 From your new Pivot Table tabs, select the Insert Slicer tool.
![]()
 On selecting it this dialog box will appear.
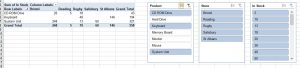
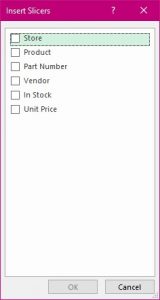 Here you can check which heading you would like to investigate. I will choose ‘Product’. This is the result.
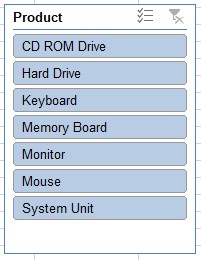 When you first select a heading to create the slicer with, it shows you all the items within that heading. You can select just one or multiples.
To choose just one, click on the item.
To choose multiples, first select the multiple tool.
![]() Then click on several records as required. You can change your mind as many times as you wish and see the results change in the pivot table report.
Then click on several records as required. You can change your mind as many times as you wish and see the results change in the pivot table report.
You can create several slicers to help you query your report.
Here is an example where not only are the two headings in play but also a third ‘in stock’.
 Now it’s just a case of selecting the items you require and you have your reports in a blink of an eye.


