Tableau has announced the general availability of its latest version 10.2. As one would expect from a pure play analytics company it is pushing the boundaries with the latest enhancements. Andrew Beers, Chief Development Officer at Tableau Software commented: “The need to see and understand data has never been greater. Enhancements in Tableau 10.2 make advanced analytics easier, faster and more scalable. We’ve added new ways to leverage spatial data, prep data and manage Tableau deployments in the enterprise. Visualizations are easier for people with disabilities to perceive and explore, making data accessible to everyone to increase business value and insights.”
So what is in Tableau 10.2

The new features can be categorised into four separate areas: Compliance, access to data, improve functionality to analytics and more user interface features. Earlier this year Enterprise Times spoke to Dave Story, VP, Mobile & Strategic Growth, Tableau. He revealed that how Tableau stays ahead of its competition. Story commented: “In 2015 we spent 31% of revenue on R&D which we believe is two to six times our nearest competitors in terms of revenue”
Those dollars are not just translating it the many features that Tableau has announced but also the future upgrades.
Compliance and security
In the interview we asked Story about the important of security to Tableau. He replied: “The philosophy is, how do we provide access to analytics anywhere anytime? We enable our customers to deploy where they want to. We are Switzerland for your data source and we respect and protect all your data at the same level of security as your data source. All the way down to row level, security is respected in Tableau. We inherit the security of your data, Tableau doesn’t make you less secure. Then we layer on top of that security around the data visualisations.
“For mobile in particular everything is encrypted in transit and at rest. We have taken a pretty secure approach. The data actually remains on the server. What is cached on the client side are pre-canned views that you can interact with. This is partly because of the range of data sizes. You actually go back to the server to run a new query.“
Tableau have enhanced the data security model in Tableau 10.2 by improving the connectivity to SAP BW (SAP Business Warehouse). This allows security levels set in SAP BW to be carried through to Tableau. There is also support for single sign-on.
Tableau has improved web authentication and now allows site and server admins to set up guest access to their systems. It has also made improvements to web content accessibility guidelines. Visualisations can now be created to adhere to WCAG 2.0 AA. For federal agencies in the US the solution now allows users to create content using features that adhere to the US Section 508 of the Rehabilitation Act of 1973. This will allow public sector organisations to develop visualisations that more users can experience.
Access to Data
Analytics solutions are pointless without data and Tableau 10.2 improves the functionality in this area too. There are several new connectors now available including Anaplan, Aster for Mac, SharePoint lists, Apache Drill and Eloqua. There is also cross database support for Salesforce, giving the ability to connect Salesforce data to other databases within Tableau. More are planned, including a direct connection to NetSuite, though there is no release date for this yet. There are now 60 data connectors supported within Tableau.
Tableau 10.2 now allows connections using join operators to connect different databases despite having different field names. In addition, users can create union tables between a SQL Server, MySql, Oracle, Postgres, Redshift, or HP Vertica database within Tableau Desktop.
Analytics
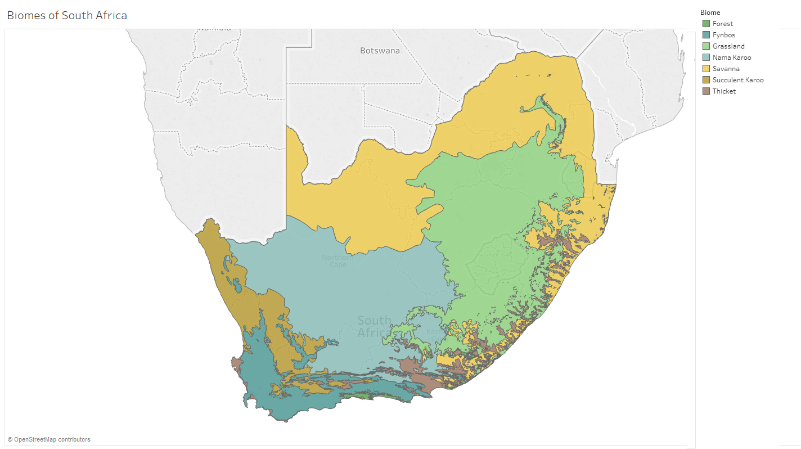
Improvements to analytics is not left out. The headline improvement is around geospatial analysis. Tableau has introduced a Spatial File Connector that allows users to connect spatial file data directly within Tableau. It now connects to ESRI Shapefiles, KML, GeoJSON and MapInfo file types.
Freddy Colina, Manager of Planning and Analytics at Lasik MD commented: “The Spatial File Connector will open up a new analytics window for us,” said “In the past, it was difficult to map using a Custom Shapefile. Now we will be able to connect directly to a customer clustering study we commissioned and some census data from Stats Canada with a few clicks and begin analyzing immediately.”
There are additional enhancements to mapping such as the addition of more detailed administrative areas for countries in Europe, Asia and Africa. There are also updates for Australia, New Zealand, India, Saudi Arabia and US counties.
In terms of numerical analysis there is support for covariance and correlation functions and a new running order label for table calculations.
User Interface
Tableau is also spending a lot of R&D money on the user interface. This release sees contextual sizing of geographic data and support for a legend for each measure. There is also greater support for story points, allowing users to improve the presentation that displays data to viewers. This is actually the latest step on the road to animation.
Story explained what Tableau what animation means at Tableau saying: ”Animation is something we are actively working on. We have something called the pages card, its like a flip book. We want to appeal to the human brain which has a lot of processing power for processing animation. There are ways to do it absolutely wrong and totally confuse the picture and there are ways to do it right.
“We are not doing traditional film animation; we are doing data animation which does not deceive you about the true path of the data. If you just go year to year and do a straight line you know that’s not true. How do you make it so that the animation doesn’t overcome the knowledge of the endpoints? We are doing things like pausing on the endpoints and things that are not physical animation but that still allow you to connect the dots.”
Tableau invests in the future
There is more to come. Story revealed that Tableau are working on a “Minority report” style interface. Like other companies they are also working on a natural language interface. This was demonstrated last year in Austin. It is currently deployed on Windows and Mac, but Tableau are also in a broad alpha program on Linux according to Story. They are also spending a lot of dollars on AI and machine learning as one would expect.
We asked what future technology Story would like to see in Tableau. He replied “I would look at augmented reality. I don’t think that many people can author true 3d but the notion of augmented reality to note what I am doing with my hands. We have voice coming so what else can I do with gestures? I think it does go towards the Minority report and its very practical.
“There is a cheap sensor that is built in on the new macs that recognises the joint positions of hands. There is also a camera that recognises what you are doing with your hands. It includes all the joint positions in your hands so you can have the device recognise where my hands are rather than using a device with my hands.”
Conclusion
This release has several features that users will see large benefits from. With the investment that Tableau is making in R&D, more than $200 million, according to Story, it seems that Tableau is aiming to stretch the boundaries of what is capable. What is positive is that they are not just creating innovative updates and solutions they are actually bringing them to market rapidly.
There are almost three levels of data interrogation now available. The first, and traditional is reporting. Software vendors that generate data are also bringing out analytics solutions. However the Tableau analytics software is still another level above that. They seem determined to keep that level of advanced analytics ahead of their immediate rivals as well as the software vendors.


