 The manufacturing sector is undoubtedly one of the largest industries in the world. However, manufacturers in the sector are facing some significant challenges. Finding skilled labour, managing inventory, optimizing production, staying on top of consumerism trends, and even scaling are just a few of the most common problems manufacturing businesses face.
As competition and consumer standards rise, addressing such challenges becomes essential. Small business owners cannot afford expensive ERP systems to track their inventory or optimize their processes. On top of that, such systems might not even be the best for their needs. Why pay a premium price for features you’ll never even use as a small business?
If you’re looking for a simple yet efficient tool to improve your manufacturing operations, these six Microsoft Excel tips may be what you need.
Track Inventory
Effective supply chain and inventory management are crucial in manufacturing. However, they’re arguably still the biggest challenge you’ll face.
If you keep too much inventory, storage will become a challenge, cash flow and profits are reduced, and your ability to adapt to customer demand will decrease. On the other hand, too little stock can mean delays for customers, as components need to be ordered before production starts. It is therefore essential to have a reliable way to track and manage inventory. However, 43% of small businesses do not track their inventory or use a manual process to do so. They are missing out on ways to optimize their businesses, improve efficiency, and mitigate waste.
To stay ahead of the competition and optimize your manufacturing, you can easily start by using an Excel template for inventory management, specifically designed for manufacturers. You can import your raw materials and stock levels, create bills of materials, and automatically update sales, purchasing, and manufacturing orders.
Managing People
Manufacturing is a labor-intensive process. As such, for operations to go on smoothly, proper resource management is essential. For this, you’ll also need to store and organize information about people, and spreadsheets are powerful, yet flexible tools to help with that.
You can use Excel to keep track of employees’ hours, training plans, vacation schedules. You can use it as a checklist for new hires, staffing or recruiting plans, evaluations, and much more. In addition to personnel, you can use it for customers, partners, or suppliers. More importantly, retrieving the data is easy, making Excel a very convenient choice.
Performance Reporting
A crucial element for growth in manufacturing is identifying bottlenecks and opportunities. Doing so will help you minimize factors restricting your growth and capitalize on those that can accelerate it. This is why performance reporting is essential. It gives you a clear picture of different aspects of the organization. As such, you can pinpoint the areas lagging behind and those you can improve.
Excel is an excellent choice in generating performance reports. You can achieve this by creating pivot tables. Unlike a static report, a pivot table offers an interactive view of your data, allowing you to explore information in different ways. You can group data into categories, break it down into certain time frames, filter it to include or exclude categories, and even build visual representations, like charts.
Strategic Analysis
Due to the complexity of manufacturing, there’s a treasure trove of data generated each day. As such, drawing actionable insights to guide decisions is challenging. Fortunately, for strategic tasks such as investment planning and asset allocation, using a few Excel tips can help you make more informed decisions. Some of the most important Excel functions for data analysis are:
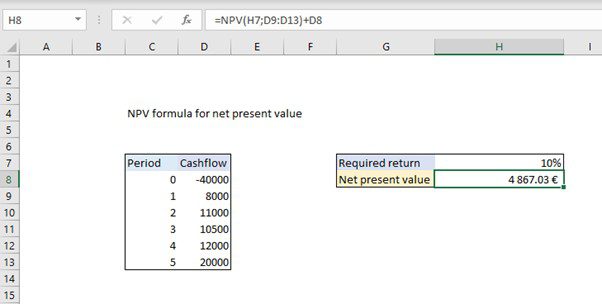
=NPV(rate,cashflows) – initialcost
The NPV() Excel function uses a discount rate and a series of future cash flows to calculate the net present value (NPV) of an investment.
Net Present Value (NPV) is the present value of expected future cash flows minus the initial cost of investment. It’s worth noting that the initial cost must be handled explicitly, because the NPV() function only calculates the present value of uneven cashflows.
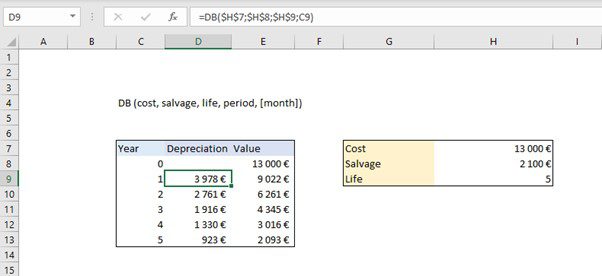
=DB (cost, salvage, life, period, [month])
The Excel DB function uses the fixed-declining balance method to calculate the depreciation of an asset for a specified period of time. It is based on initial asset cost, salvage value, and the number of periods over which the asset is depreciated. Optionally, it includes the number of months in the first year.
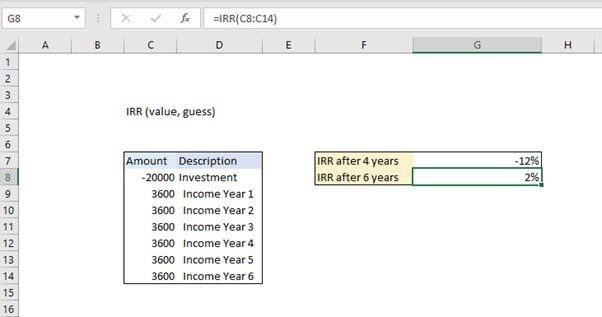
IRR()
The Excel IRR function calculates the internal rate of return (IRR) for a series of cash flows that happen at regular intervals. Simply put, it is the interest rate received for an investment with payments and income happening at regular intervals. The amounts given can vary, but the intervals must be the same. If given, Excel starts with the guess to calculate the result using interaction. If a guess is not provided, it starts with 10% (.1).
Accounting
When it comes to accounting, Excel is the go-to solution for most businesses. In fact, data indicates that up to 90% of companies use Microsoft Excel for planning, budgeting, and forecasting operations.
One of the primary reasons for this is that the columns in the spreadsheets make it easy to arrange the information. As a result, basic data management, such as adding up or subtracting against columns, is straightforward.
But beyond this, there are numerous Excel features that automate formulas and calculations. As such, there is no need to redo operations each time you introduce new data. Some of the accounting documents you can create using Excel include income statements and balance sheets.
Create Visualizations
By nature, human beings are visual creatures. This means that your brain is significantly better placed to process visual representations instead of raw data in text form. This is why it’s difficult for you to interpret spreadsheets full of numbers and words.
Excel has the capabilities of producing data visualizations. These come in the form of bar charts, pie charts, scatter graphs, and many others. As such, the information is presented in an easy-to-understand and compelling format. You can create your own or use the chart templates recommended by MS Office.
Unlock the Full Value of Microsoft Excel
While it’s easy to overlook Excel when looking for solutions to optimize your manufacturing, it’s arguably one of the easiest choices, especially for small product-making businesses or those just getting started. You can use Excel for a wide range of functions, from accounting to inventory management. It’s also cost-efficient and relatively easy to implement. All you need to do is take some time to understand the host of features available.
 Katana is a manufacturing ERP that gives you a live look at your business. Features include live inventory and manufacturing management, batch tracking for end-to-end traceability, a Shop Floor App for total floor-level control, open API, and a growing channel partner network. Real-time master planning features automate resource allocation based on prioritized sales orders and integrations with e-commerce, accounting, CRM, and reporting services to centralize all key operations.


