 Many AIOps vendors have concluded that man does not live by maths alone. When presenting algorithm results, the consensus now is that visualisation must accompany it. This is because IT Ops professionals are trying to present complex constructs. Visualisations are not just eye-candy; they contain implicit outcomes in relation to what the algorithms are trying to deliver. In many cases, a topological or two- to three-dimensional graphical representation effectively illustrates the consequences of algorithms. It also identifies the objects on which the algorithms are working.
One of the problems with standard approaches to topology visualisation is that the representation itself becomes so complex that it overloads the eye of the user and cannot be used for any kind of analysis.
Indeed, even a rather simple system with approximately 20 nodes can generate a mesh of 400 lines. An IT operations professional trying to trace visually how the impact of an incident fans out across that mesh will be lost almost immediately. Hence, it is critical when providing a topology-based representation to visually emphasise those elements of the graph being viewed by the user that stand a very good chance of being relevant to tracing the impact of outage inducing events. Of course, this can only be done via an algorithm that, without human intervention, can take any topology as input and, purely based on that topology’s structural properties, pick out the critical nodes and links between them.
Complexity and AIOps
When you apply AI, you have three levels of complexity IT Operations teams must manage. Firstly, you have the environment: the IT systems themselves. Secondly, you have the self-describing data that is generated. Thirdly, you have the diverse tools that are trying to grab different subsets of data to ultimately understand what is going on in the underlying systems.
In each layer, having some kind of representation which takes the form of a two- to three-dimensional graph can help the user visualise problems and solutions – an assistant for thinking. The graph can contain useful information, but ultimately there is an aesthetic attractiveness to seeing a multi-dimensional representation that appeals beyond the IT Operations team. It is something that a business user can have as a comfort blanket. It makes it real to the business and decision-makers, even if that person does not fully understand what he is seeing.
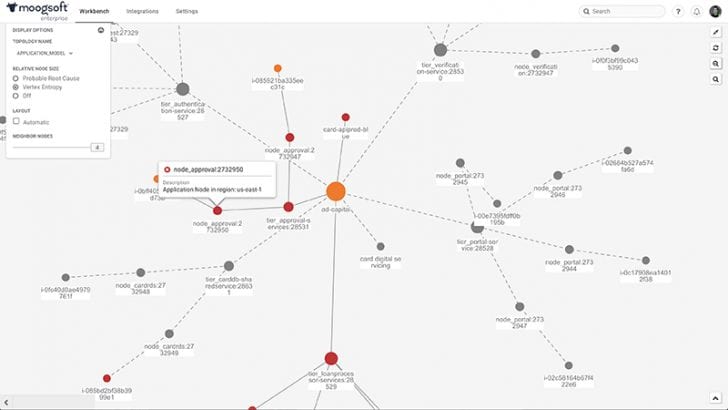
AIOps tools are functioning at an abstract level. Its maths content is exceptionally high, and the structures within AIOps technologies are very intricate. A visualisation tool makes it all more consumable, as you can see below.
The Democratization of AIOps
In the early days of AIOps, there was a presupposition — fair or not — that you needed a team of data scientists to work with the tool because only data scientists could understand AI.
Traditionally, those who used AIOps tools tended to have a data science and maths background. For them, topology was a nice to have. They could make up the pictures in their heads. Now we’re at a tipping point with AIOps, and more enterprises are deploying it. Those not used to thinking like a data scientist need visualisation to make the most of the technology. AIOps platforms no longer require data scientists’ skills. Emphasis is now placed on topology, which is a side effect of the democratisation of AIOps.
The Three Layers of Topology
There are three levels of abstraction when considering topology. The first, which has been in IT Operations tools since the early 1990s, is to present a stylised picture of network infrastructure. What is on the screen is meant to be a picture of what’s out there. It is a “Google Maps” type of construct, providing a map of your environment.
The second topological abstraction originated due to virtualisation at the infrastructure level and the growing importance of managing and monitoring applications. It deals with software objects that have relationships with one another, and which could be portrayed in a graphical form, so it looked like a network topology.
However, in reality, the display of connections between software components was metaphorical. It’s not a physical representation, but it illustrates the passing of messages between software objects. When you look at the majority of AIOps tools in the market today, that’s what they’re doing.
The Advantages of a Graph Structured Approach
There is a third level of topology. It’s one that no longer looks at objects, but looks at graphs as mathematical objects and interacts with them in terms of their pure graph structure. It’s only an accident if there is any connection between the nodes in the graph, the links between these nodes, and any kind of underlying reality. The algorithms are not interested in what those nodes are. They’re only interested in the graph structure.
It’s a purely mathematical structure, and that’s where the most advanced AIOps solutions operate in terms of topology and AIOps. There’s an enormous amount of information you can derive from correlation and causality among events that you can get from just looking at the graph structure. Concerning yourself with the details of the software and physical objects becomes a distraction.
Visualisation is Key
When you’re dealing with the third type of topology, you need to visualise it. Today, visualisation helps to guide users through this pure abstract mathematical structure, rather than being a tool that is giving you information about the underlying environment. The advantages of dealing at this graph level are that you can do a lot knowing very little about the underlying details of the system. You basically just need to know that there is a pattern of connections between the different nodes.
Topology is driving the evolution of AIOps, making it easier to deploy and understand its deliverables – and making it appealing to a much wider audience.
![]() Moogsoft is a pioneer and leading provider of AIOps solutions that help IT teams work faster and smarter. With patented AI analyzing billions of events daily across the world’s most complex IT environments, the Moogsoft AIOps platform helps the world’s top enterprises avoid outages, automate service assurance, and accelerate digital transformation initiatives. Founded in 2011, Moogsoft has more than 120 customers worldwide including SAP SuccessFactors, American Airlines, Fannie Mae, Yahoo!, and HCL Technologies. It has established strategic partnerships with leading managed service providers and outsourcing organizations including AWS, Cisco, HCL Technologies, TCS and Wipro. For more information about Moogsoft’s AIOps platform and its newest addition of customers, visit www.moogsoft.com.
Moogsoft is a pioneer and leading provider of AIOps solutions that help IT teams work faster and smarter. With patented AI analyzing billions of events daily across the world’s most complex IT environments, the Moogsoft AIOps platform helps the world’s top enterprises avoid outages, automate service assurance, and accelerate digital transformation initiatives. Founded in 2011, Moogsoft has more than 120 customers worldwide including SAP SuccessFactors, American Airlines, Fannie Mae, Yahoo!, and HCL Technologies. It has established strategic partnerships with leading managed service providers and outsourcing organizations including AWS, Cisco, HCL Technologies, TCS and Wipro. For more information about Moogsoft’s AIOps platform and its newest addition of customers, visit www.moogsoft.com.


