 Neo4j has announced a new bundled offering, Neo4j for Graph Data Science. It believes that it is the first Enterprise Graph Framework for Data Scientists. Enterprise Times spoke to Amy Hodler, Director, Analytics & AI Programs, Neo4j about the launch.
The solution is targeted at data scientists within enterprise organisations. Hodler explained further saying: “It’s the people that need to do very advanced data analysis, or they need to make predictive models. Those people building the models would use Neo4j as a source material to extract more predictive elements and then put those in their models. “
What is Neo4j for Graph Data Science
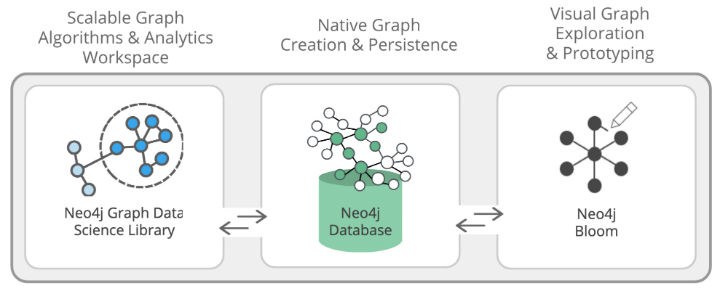
Neo4J consists of three components:
- A native graph analytics workspace.
- A graph database with optimized scalable graph algorithms.
- Graph data visualization in Neo4j Bloom helps teams explore results visually to quickly prototype and more effective collaboration.
 This is not a completely new product but relies on several existing products from Neo4j including its graph database. ET asked Hodler what is actually new?
“The graph Data Science Library, which is how you create the analytics workspace. It has two components. It has a catalogue that creates the virtual workspace which abstracts the graphs and puts them in a format that’s the most efficient for a computation. The other component is the graph algorithms themselves.
“Those algorithms are basically math that you run to get a score or a classification. Then you use those elements to build your model. We took what we had last year which was an algorithms library and we rewrote all of the APIs surrounding that, and then hardened all the algorithms as well. Then we added that capability for that analytics workspace.
“Then we’ve done some tweaks to the visualisation tool so that it could drive its visualisation from algorithm results.”
Answering the why
Alicia Frame, Lead Product Manager and Data Scientist at Neo4j, explained why Neo4j for Graph Data Science is the most expeditious way to generate better predictions.
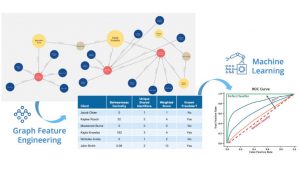
“A common misconception in data science is that more data increases accuracy and reduces false positives. In reality, many data science models overlook the most predictive elements within data – the connections and structures that lie within. Neo4j for Graph Data Science was conceived for this purpose – to improve the predictive accuracy of machine learning, or answer previously unanswerable analytics questions, using the relationships inherent within existing data.”
Hodler then explained why it is important.

“Relationships are extremely predictive of behaviour and we see this in a lot of scientific studies. Network science uses relationships to try to predict what’s going to happen in the future. There’s nothing better than a graph to derive relationship-related material because graphs codify how things are related.”
What are those unanswerable questions though?
“For example, what is the most significant predictor of a good patient outcome versus a bad patient count outcome over three years? That is what path do people take to the best health? Why that was unanswerable previously is you have to understand the path that people take from A to F over three years. As well as every test they’ve had, every doctor visit. What were the outcomes? What were the test results? How do those all map in a complicated path from A to F? Then looking at how those map, where can we intervene faster, to have a better outcome? Anything to do with complex relationships or paths are really, really hard to do to the point of being impossible to do if you’re not looking at something that shows relationships and paths.”
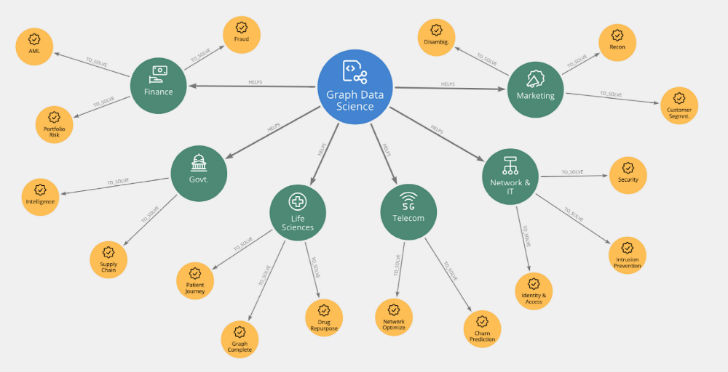
Who should use Graph Data Science
One of the most common use cases of this is fraud analytics. Neo4j believes this has a compelling ROI, often realising millions of dollars. Hodler sees several use cases:
“We’re seeing a lot of fraud use cases. Part of that is fraud has a shape in data that has to do with how things are related. For example, floating islands of interactions where people are interacting a lot financially with each other, but not with anybody else. You can see that in your visualisation tool.
“Take the healthcare Life Sciences patient journey, as well as drug repurposing. If a drug is good for one thing, and there are some genes in common with another disease, you can actually draw a path from a drug from one disease to another an indirect path.
ET asked Hodler whether there were any less obvious but worthwhile use cases that may not have an obvious ROI. She answered with a personal view saying:
“I have talked to some nonprofits looking at using graphs to do better matchup of humanitarian aid with people who want to donate for humanitarian reasons, with projects and with technology. That a graphy kind of problem.
“You have people with finance, you have people with certain technical expertise, and you have a lot of people in need. Where do you fund to get the best outcome and output? Often a lot like that patient journey. Understand what’s worked and what hasn’t worked, and then where do you intervene earlier. It’s hard to come up with an ROI number. I think there’s an indirect ROI if we can measure appropriately the success of the different humanitarian projects. That’s just personally where I would like to see graphs be used more. That might be in the government space with funding of different projects, and in the humanitarian space as well.”
Other use cases
On availability and pricing
The product is available now. Hodler commented on the pricing saying: “We are bundling the three components together as a single SKU line item.” Neo4j does not typically publish pricing. It provides three types of licensing:
- Community edition, an open-source offering using the GPL v3 license
- Enterprise Edition, a commercial version with three deployment types: Commercial license, develop license and evaluation license
- Aura: A subscription-based cloud offering
Enterprise Times: What does this mean
This is a product that will appeal to enterprises and their data scientists that want to maximise their productivity. Data Scientists are expensive and in providing this framework Neo4j is delivering productivity tools to increase efficiency.
It can also make a difference today. Dr. Alexander Jarasch, the Head of Data and Knowledge Management at the German Center for Diabetes Research (DZD) and collaborator on COVIDgraph.org, explained how Neo4j for Graph Data Science offers an intuitive data science experience with logical parameters and Neo4j Bloom for comprehensive graph exploration. Jarasch commented:
“Nothing is more pressing today than understanding COVID-19. Graphs give us the ability to bring together the salient information around this confounding disease and provide a synthesized view across heterogeneous data. Today’s understanding of this coronavirus is severely hampered by minimal peer-reviewed research and the absence of long-term clinical trials. Neo4j for Graph Data Science will help us to identify where we need to direct biomedical research, resources, and efforts.”


